


 |
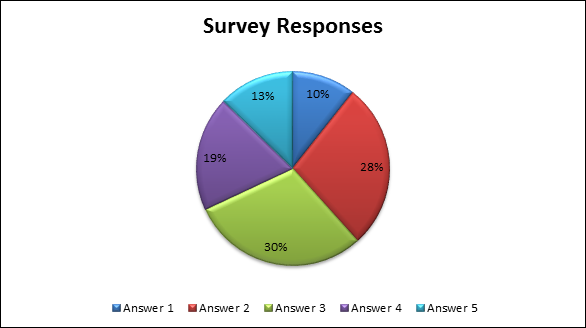
| Survey Responses |
|---|
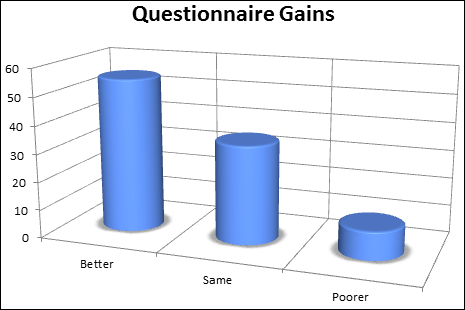 |
| Questionnaire Gains |
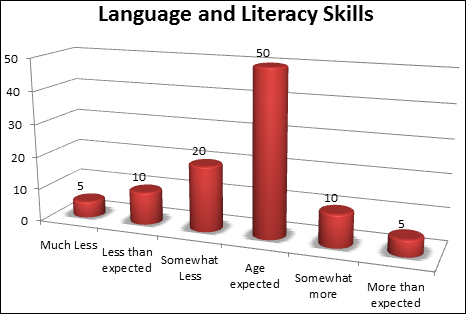 |
| Aggregated Assessment Ratings |
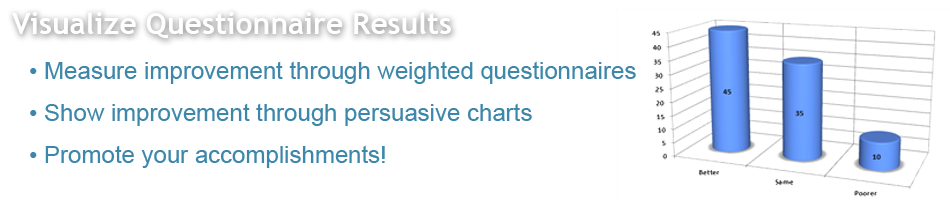
Step 1: Select the desired Survey, Questionnaire, and Assessment instruments.
Step 2: Enter data into the intuitive data entry templates.
Step 3: Select and run the desired reports.
All Analysis and Gains reports automatically generate a complete set of Excel-based graphs that can be edited using Excel's rich set of Chart tools.
KinderCharts is:
KinderCharts provides excellent training materials, comprehensive online HELP with step-by-step instructions, and personalized support to ensure you get up to speed quickly and get the most out of your KinderCharts subscription.